Today was a tag recovery day for SOCAL-11. The Rissos dolphin tag from yesterday afternoon rode around on the animal overnight and it was quite a ways from where we started. We again put someone on an island to listen for it and had both our small boats searching and it took until afternoon to find it. We did hear a sperm whale (or more) in the distance and tried for most of the day from the other boats to locate it, but never managed to. We tracked a nice group of common dolphins for a while as well, testing our group sampling protocols for doing sound playbacks to groups of animals without tags. As we have done in the past, below is a some information on one of the many capable tools used in SOCAL-BRS. This project requires many different specialized capabilities, and this geospatial software is among them. Thanks to C. Kyburg of SSC Pacific for this contribution.
The Whale Identification Logging and Display (WILD) software serves several functions for the research team. Animal observations are recorded and displayed on a map in plan view as well as the positions of all research vessels in real time. This permits the team to coordinate animal tagging as well as setting the stage for successful sound transmissions in controlled exposure experiments (CEEs). The mapping portion of WILD also displays bathymetry, shorelines, marine sanctuary boundaries and other contextual information (e.g., location of research and some other vessels). There is a WILD mapper display on the flying bridge where the visual observer team operates and another display on the bridge of the ship. Having the same map information real time in both locations allows for effective communication between the visual team, the ships helm and the chief scientist. The result provides the chief scientist effective tactical decision support for both tagging and playback operations.
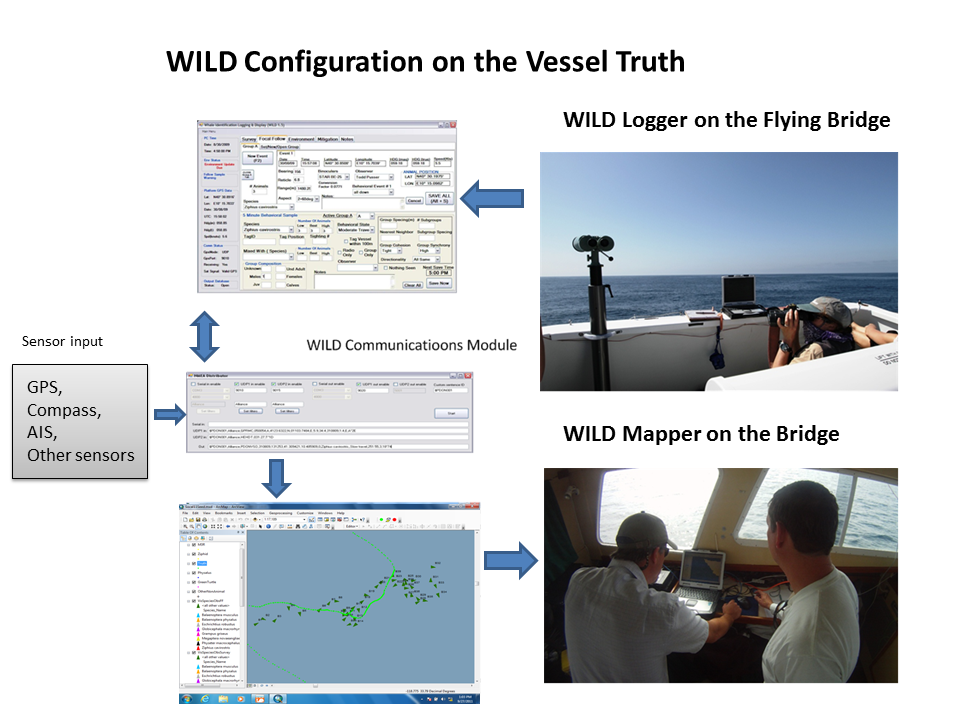
Configuration of WILD aboard the Truth. The logger Observations are recorded on the Logger module on the flying bridge. The animal positions are immediately posted to the WILD Mapper both on the flying bridge and the Bridge. The WILD communications module provides navigation information to all components as well as animal observations to the Mappers.
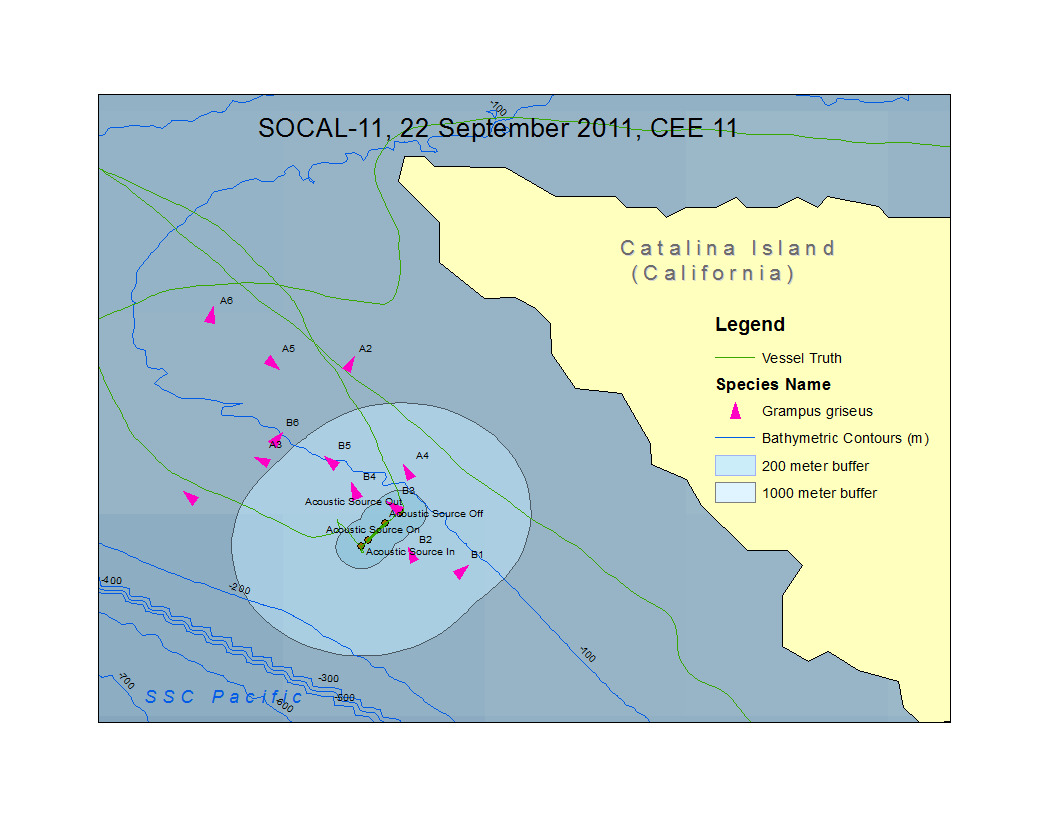
The illustration above shows a summary from WILD of a playback sequence. The map includes the 100 meter bathymetric contours represented by blue lines and land (yellow). The central research platform, the R/V Truth, is represented by the green line, and the focal animal group for this experiment (Risso’s dolphin – Grampus griseus) is represented by the pink triangles (animal ‘A’). An individual within the focal group is affixed with a WHOI D-Tag recording device. Each individual or group of animals tracked by the visual team is represented by identifier (the letters on the map) and sequential observation numbers (the number appearing after the letter on the map). The two buffer rings on the map are the 200 meter and 1000 meter rings around the main platform. Any marine mammal within the 200 meter ring requires the experiment to be terminated for the safety of the animal(s). The 1000 meter ring allows researchers to determine animals that are incidentally exposed at a level where they may be behaviorally affected according to the operating conditions of the permit. In the case of this playback the experiment was terminated after 15 minutes because another Risso’s dolphin (animal ‘B’) entered the 200 meter zone. . Even with the experiment terminating early to comply with operational protocols and permit requirements, valuable data is still obtained from the tag on the focal animal. This example demonstrates the importance and efficacy of a real-time mapping tool to integrate visual sightings, vessel positions, depth and range to shore information, and other data in a common environment for decision-making and visualization of operations. [WILD software was developed by Spawar Systems Center, Pacific to support a variety of marine mammal survey programs and the SOCAL-BRS.]